
A group of scientists – analysts from the Belarusian Institute of Strategic Research has developed a methodology for creating an intersectoral forecasting model, which can be used to track the performance of industries according to a large list of macro indicators and make short-term forecasts. One of the authors, Doctor of Economics, Professor, Head of the Department of Economics and Management of the Belarusian State University of Economics, BISR analyst Alexey Bykov shared the principles of creating a new forecasting model.

— Alexey, what is the essence of your work from a scientific viewpoint?
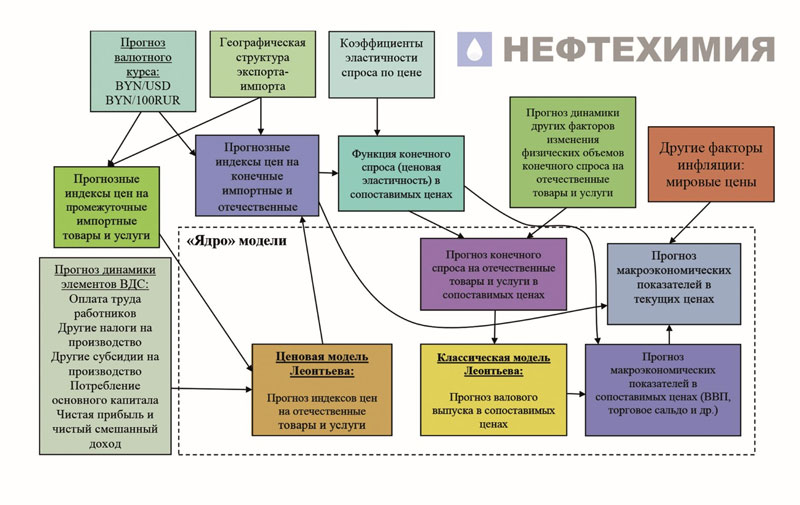
— We are developing an approach to building a module-based intersectoral model of the Belarusian economy. The model is used for scenario forecasting of macroeconomic parameters for a month, quarter, year. The input parameters of scenarios are set by experts and may include, for example, forecast exchange rates, demand indices for certain types of goods and services in the domestic and foreign markets. The proposed architecture implies the use of an aggregated 16-industry input-output model as the core. We made a forecast for 2023, and formed it for 2024.
— Sounds impressive, but I would like to know how the idea came about?
— Macroeconomic forecasts are made in all countries, all international financial institutions are engaged in this — the IMF, the World Bank, the EDB.
In Belarus, the Research Institute of the Ministry of Economy is engaged in forecasting socio-economic development, the National Bank is engaged in monetary policy targets. To make a comprehensive forecast of scientific and technological progress in fifteen sectors of Belarus using the foresight method for 2026-2030 and for the period up to 2045, an interdepartmental working unit led by the Chairman of the State Committee on Science and Technology was established, which included about 200 people.
With the development of artificial intelligence, many information processing methods have appeared. Some specialized websites provide online results of macroeconomic analysis and forecasts for all economies of the world. It would seem that the accuracy of conclusions should increase, but, as practice has shown, this is not always the case.
Sanctions and military conflicts have influenced the initial forecasts of international financial organizations such as the IMF and the World Bank. For example, for Russia and Belarus, GDP was predicted to fall by 6-10%. But in fact, in 2022, Belarus' GDP decreased by 4.7%, but by the end of 2023 it is expected to grow by 3.8%, in Russia — by 3.5%. This suggests that the models are not quite perfect. Most forecasts are confirmed only in a stable macroeconomic situation, when there is no cardinal deviation of the parameters.
— Why is this happening?
— First of all, because all forecasts use mainly dynamic models based on trends. The simplest one is linear. But modern models use nonlinear relationships of indicators — these are complex trends with seasonal and other cyclical fluctuations. That is, the models still remain trending, since they extrapolate past trends for the future and cannot foresee radically profound changes.
Today, structural restructuring is taking place in economies of countries. And hardly anyone can foresee the complexity of the picture, all adaptive mechanisms. Artificial intelligence in this area cannot yet replace an expert who needs to intuitively represent many processes.
— How original is this technique?
— Besides me, Vladimir Parkhimenko, Head of the Department of Economics of Belarusian State University of Informatics and Radioelectronics, Candidate of Economic Sciences, Associate Professor, is working on its development and making forecasts. His ideas have been taken as a basis. He works with input-output tables, i.e. the cross-industry balance sheet. A couple of years ago, we published an article on how the dollar exchange rate, inflation, exports, imports and GDP are interconnected.
In principle, balance sheet models are used in forecasting both in our country and around the world. This tool was developed by Nobel laureate Vasily Leontiev(Russian-American economist, the creator of an inter-industry theory analysis, winner of the 1973 Alfred Nobel Memorial Prize in Economics "for the development of the input-output method and its application to important economic problems" — ed.). .This method was widely used in the USSR, the USA, and Japan. Now there are interregional, intercountry, and even intersectoral models of the global economy.
For Belarus, the idea of using exchange rates as an input parameter for making macro forecasts using an intersectoral model is new. Its peculiarity is that exchange rates change relative prices. For example, if the dollar strengthens against the Belarusian ruble, it means that imports in our market become more expensive for us, and Belarusian exports becomes cheaper for foreign customers.
Each product in the markets has its own price elasticity of demand. For example, for potash fertilizers, this elasticity is low because there is a global price and long-term contracts. That is, the demand for potash fertilizers almost does not respond to changes in the exchange rate of the Belarusian ruble against the dollar. Due to the fact that, let's say, the cost of potassium extraction will become cheaper, it is not a fact that can sell it more. The same applies to oil products.
But food exports should theoretically grow with the falling Belarusian ruble. After all, the cheaper our food products become abroad, the more we will can sell them. This situation is called the devaluation effect.
Similarly, changes in demand in the domestic market are estimated when relative prices change. If the Belarusian ruble depreciates against the dollar, imports become more expensive — and fewer people buy imported goods in our country. However, many Belarusian products contain intermediate imports – raw materials, parts, semi-finished products. All industries are characterized by different levels of import intensity, i.e. they contain a different share of imports. For example, in Belarus, oil products have the largest share of imports, because they are produced from Russian raw materials, and IT services have the smallest share — there are almost no imports in their cost structure.
— In theory, everything is clear. And how does it look like in practice?
— In practice, forecast data is introduced into the model not only for the exchange rate of the Belarusian ruble to the dollar, but also to the Russian ruble. Also, all goods and services are differentiated by import and export markets — some, for example, are supplied from Russia, where payments are made in Russian rubles, others from other regions of the world, where prices can be pegged to the dollar. Economy has complex production chains where raw materials are supplied from one region of the world and paid for in one currency, and finished products are exported to another region with payment in a different currency. Given the currency rate dynamics, the model becomes more complicated.
Let's say, we buy components in China. We sell equipment made on their basis in the Russian Federation. As the dollar exchange rate increases, the cost of Belarusian products with Chinese components on the Russian market will entail an increase in the cost of our products and, therefore, drop in competition and demand. But there may be another situation when we buy goods in Russia and sell them to another country for dollars.
Our forecasting approach takes into account the structure of production chains, as well as the linking of certain products to certain sales markets. We model two main indicators — GDP, which depends on output, and it, in turn, depends on demand, and the trade balance (foreign trade balance). As a rule, the devaluation of the Belarusian ruble against foreign currencies leads to some decrease in output and GDP, but also to the trade balance improvement. This is due to the fact that imported products become more expensive during devaluation, they are purchased in smaller quantities, therefore our trade balance improves because of reduced currency consumption.
According to the logic of economic processes, the exchange rate is a consequence of the whole economic activity, and does not determine it. In reality, the exchange rate of the Belarusian ruble is formed based on outcomes of the trade balance and other factors. In our model, we do the opposite: we take a rate and deploy all forecast prices from it. In one of the options, we use the forecast exchange rate of the Russian ruble against the dollar as a determining factor. Based on it, we estimate what situation may appear in our market, and then we make a forecast. It is important for us to correctly describe how the economy works.
Today, it is evident that the situation on the Belarusian import market has changed. What we used to buy in Europe, we are now buying in China. But with exports, we are now more tied to the Russian market. Previously, its share in our exports was about 40%, but at the moment it has grown significantly. It turns out that the exchange rate of the Russian ruble against the dollar strongly affects our well-being, as well as macroeconomic indicators in Belarus.
— Could you, please, briefly describe the algorithm of your model?
— It is based on input-output tables system, which describe the current state of the economy. This system shows the industry structure, income distribution, etc. The problem is that the intersectoral balance sheet is drawn up two years late. Last year, we received data from the input-output tables for 2021. And we needed them for 2023 to make a forecast for 2024.
In our model, to develop input-output tables for 2023, we made a retrospective forecast taking into account already known statistical data. We took 2021 data and used them to build a balance sheet for 2022. Then from 2022 for 2023. According to the available information, certain indicators were monitored. Indices of demand volumes and prices were introduced.
The intersectoral balance of Belarus consists of 83 branches. It turns out a huge matrix. We made it smaller — aggregated to 16 types of activities. On a 16 by 16 matrix, we make retrogressions. Then, according to known data, we obtained the structure of the economy for 2023.
To make a scenario forecast for future months, quarters, or a year, we generate sets of input data describing possible scenarios. For example, as such data, you can use the expected exchange rate of the Russian ruble to the dollar, from which the rates of the Belarusian ruble to the dollar and to the Russian ruble are calculated. Also, when forming scenarios, we use data from other forecasts on demand in the Russian and other foreign markets, and world prices for raw materials. Of course, you can't make a forecast based on the exchange rate alone, since the most important thing in it is the expert assessment of an economist. In particular, he should understand in which industries the demand will increase and in which it will decline.
— What are the main industries used in the model? How did you define them?
— We have consolidated industries based on the value chains aggregation principle — from raw materials to finished products. For example, we combined agriculture and the food industry; forestry — with woodworking, paper production, furniture. Mechanical engineering has included instrumentation, electronics, machinery, equipment, motor vehicles. As a result, we get 16 industries for which we set demand indices in the domestic and export markets. Indices additionally change under the influence of prices. As a result, we make the first step of the forecast — a matrix representing the outlay of demand and price indices for all domestic goods in the domestic and foreign markets. The second step is to enter the changed volumes and prices and build a forecast matrix "input-output" in a computer program, and then create a monthly forecast./p>
— How long have you been developing such a forecast model? What do the results say about the macroeconomic situation in 2024?
— We have been working on the model since January 2023 and are now refining it to make it understandable to a wide range of economists.
Regarding the 2024 forecast, I can say that the situation will not be worse than in 2023. This program cannot model the distribution of income by sector. But in general, economic growth is expected with two calculation options. We didn't get high inflation like in 2022.
— Is the technique fully "operable"?
—The model helps the expert who makes up the scenario to provide various options, sort out all the information. At the same time, the specialist must know the economic situation himself, understand what is expected in the future.
We would like to turn our modular cross-industry model into a complete digital product, made in the form of a user-friendly computer program with its full description. Then a trained economist will be able to easily understand it, enter their own input parameters and receive individual forecasts.
PHOTO by Elizaveta Lukashun, BISR